
See also our notes on how we assign hardiness zones to plants here at Plant Delights Nursery and also take a look at our zone by zone plant buyers guide.
USDA Hardiness Zone Finder Tool
History of the US Hardiness Maps
Most folks who have ever read a gardening book or plant catalog are familiar with plant hardiness zone maps. The first US map with 8 hardiness zones was compiled at the Arnold Arboretum in 1927 by Dr. Alfred Rehder, based on a survey of plants and their survivability in different regions of the country. The map was first published in Rehder's Manual of Cultivated Trees and Shrubs.

Brunnera macrophylla 'Jack Frost'
In 1938, Dr. Donald Wyman of the Arnold Arboretum published a new map in his book, Hedges, Screens & Windbreaks, that used 40 years of data (1895-1935) from the US Weather Bureau. The Arnold Arboretum map was updated in 1951, 1967, and 1971.
In 1960, the US Department of Agriculture got into the act, publishing its first map, based on the data from 450 weather stations around the country. Unfortunately, they used different criteria from the Arnold Arboretum for establishing their zones, resulting in two conflicting maps.
The Arnold Arboretum map remained the standard over the 1960 USDA map until 1990, when the US Department of Agriculture, in cooperation with the U.S. National Arboretum, updated the USDA hardiness map, using data from between 4,800 to 14,500 weather stations. Various publications by Dr. Marc Cathey, who oversaw the map project, have given a wide variety of radically varying weather station numbers. I expect the low end would be more accurate. Although Cathey also claims to have used a 15-year dataset, the 1990 map actually used a 13-year dataset from 1974-1986 (US) and 1971-1984 (Mexico). This revision shifted most areas into zones that were one half to one zone cooler than the previous Arnold Arboretum map.
What the Maps Don't Tell Us
With hardiness zone maps, gardeners could now trace zone lines around the country to find out which plants they could possibly grow in their own region. Let's see here ... Raleigh, North Carolina, is in the same zone as Reno, Nevada, Dallas, Texas, and most of Vancouver Island in Canada ... could this be right? In fact, the answer is a resounding "No." You are beginning to see a few of the problems with the USDA winter hardiness map.
Each of the current USDA 20 climatic zones (Zone 1, 2-10a,b, Zone 11) is based on the average minimum winter temperatures. In Zone 7b, which includes Raleigh, our average winter minimum temperatures should be from 5-10 degrees F. Keep in mind that there is often a major difference between what will grow in the "a" and "b" regions of each zone.
What the winter hardiness map doesn't tell us is how many times the temperatures dropped that low, and how long these low temperatures lasted. There are a number of plants that can survive 5 degrees F for a couple of hours, but could not survive these temperatures for a longer period, or more than once during a winter. Cold temperatures for one night is not the same as cold temperatures for a period of weeks, even though the same low temperature is reached in both cases. In many cases, a low temperature of 0 degrees F, may cause cellular damage that will start to heal if the temperature rises rapidly. If the temperatures remain low for several days, cell damage may continue and result in the death of the plant.
It is truly difficult trying to assign a hardiness zone to all plants, especially when using the minimal 10 USDA Zones. This is why we find it critical to differentiate between the "a" and "b" zones whenever possible ... we would prefer a "c" and "d" also. A drawback to growing new and different plants is that there is no information on their hardiness.
Another factor not taken into account by maps is winter acclimation. A plant growing in our gardens in midsummer can be easily killed by temperatures in the 20 degree F range. The same plant, if properly acclimated, can withstand temperatures of -20 degrees F. We see the exact same thing in some late spring frosts. After a certain number of hours at a specified temperature, each type of plant will switch from a dormant winter mode to a growing spring mode. It is at this point that winter hardiness is lost. If a late frost occurs while the plant is still in its dormant mode, there is little, if any, damage. If the late frost occurs after the plants have switched to active growing mode, even a mature tree may be killed.

If we have an abnormally warm fall, many plants that rely on cool temperatures to trigger dormancy can be killed when the temperatures drop suddenly. Several years ago, we went from 70 degrees F to 4 degrees F in the same day, suffering losses on many "hardy" woody plants that simply had not prepared well for winter. In Raleigh, we have found many "tropical" plants to be hardy that are not hardy further south in Florida. Unlike climates further south, we have a cool period in fall that allows the plants to shut down and prepare for winter.
Another phenomenon, seen in England and in the cool areas of the West Coast of the US, is the difference in winter hardiness due to a lack of summer heat. In many plants native to warmer climates, summer heat causes increased sugar production, which allows the plants to survive more stress in the winter. In areas without summer heat, a particular plant may only be hardy to 20 degrees F, while in an area with hot summers, the same plant may easily be hardy to 0 degrees F.
Another factor in hardiness is precipitation. I trade plants with friends in New Mexico, who are in the same hardiness zone as we are in North Carolina. In New Mexico, the plants receive less than ten inches of rain per year, while we can receive more than five times that amount. We have discovered that there are a number of plants that can survive our cold temperatures, but cannot tolerate winter moisture. A good example is many of the barrel type cacti which are naturally found in very cold mountainous regions, but regions that receive no winter rainfall.
The opposite effect is equally dramatic. Snow which blankets many areas in "snow belts" helps to insulate many "non hardy" plants. Gardeners whose gardens are covered in snow most of the winter are often able to grow plants, especially perennials, nearly two zones outside their normal range, due to the insulating effect of the snow. On woody plants, a snow layer will often protect the roots and lower branches of a plant while the top growth is still killed back to the snow line.
Ice is an entirely different matter. Ice doesn't have the insulating effect like snow, since there are no buffering air spaces. A plant under an ice layer will actually "supercool" and become colder than the ambient outdoor temperature. Many growers use ice to protect crops during freezes, but this only works at a very narrow range of temperatures (not below 24F), and only if water is constantly applied (and at the proper rate). As the water freezes, it releases heat. As soon as the water application ceases, the protection disappears also.
How about provenance? Provenance, in lay terms, means where did the parents come from? Just like children, offspring bear some resemblance to the parents. Plants are similar, in that seed taken from a tree in Minnesota will be more cold hardy than seed taken from the same type of tree in Florida. Conversely, the plants from the Minnesota seed source might never break dormancy in Florida due to the lack of winter cold. Plants, however, that migrated from a cold region to a warm region during glaciation or other such event may not necessarily lose winter hardiness until many millenia later. This is why many plants from regions such as the Florida Panhandle (Zone 8b) are hardy to Zone 5.
The issue of provenance is important in perennials, but not nearly so as it is in woody plants. Since perennials usually die to the ground in winter, there are no above ground parts to sustain winter damage. Many reference books may indicate that red maples are hardy from Zone 2-9. Granted, there may be red maples growing in both areas, but to interchange seed from each area would likely prove disastrous. This problem is particularly dramatic in woody plants that are grown from seed. It is also usually the most important at the extremes of the zone for each plant. In the case that we mentioned, the gardeners in Zones 2,3 and 8,9 would need to be the most cautious of the provenance.
Hemerocallis 'Penny's Worth'
Cultivars, or vegetatively propagated identical plants (clones), keep the same hardiness regardless of where they are produced commercially. In other words, Hemerocallis 'Stella D'Oro' has the same hardiness whether it is produced in Florida or Chicago. The hardiness of a plant is based on the origin of the original genes, not where we, as humans, move the plants.
Also related to hardiness is the issue of fertilizers. Research has indicated that a fall application of a high potassium fertilizer (assuming the plants or soils are deficient) aids in winter survivability of many plants. Conversely, an early fall application of nitrogen can make plants which are not induced into dormancy by day length, continue to grow, causing them to be more susceptible to winter damage.
We have all heard about not pruning some shrubs in late summer and fall. This is because some plants respond to pruning by producing new growth which is quite tender and is easily killed since it has not become acclimated to the cold temperatures.
If you enjoy growing plants in zones which are too cold, try to create microclimates. Microclimates are areas of your garden that are particularly protected, such as near a brick wall, near heat vents from the house, near a body of water, between two structures, in courtyards, or other such areas. Good plant nuts can usually squeeze out an extra zone in either direction ... that should build some egos! If you enjoy experimenting with marginal plants, I urge you to invest in battery-operated digital min/max thermometers. These can be placed around your garden and will record and save minimum temperature readings. You can determine which areas stay warmer in the winter and use this information to site marginal plants.
Adiantum hispidulum 'Mt. Haleakala'
As mentioned, the siting of marginal plants is critical. Marginal evergreens should be located on the north side of a structure or in some shade in the winter time. With the ground frozen, the evergreen foliage is desiccated since water given off to the sun and wind cannot be replenished. With deciduous marginal plants, a location in a sunny spot will allow the ground to warm, often making the difference in survivability.
Not to be overlooked are rodents that are active in the winter. Many reports of plants that didn't survive the winter temperatures are actually plants that have become dinner to hungry rodents. Be aware particularly of voles, tiny rodents that tunnel around your plants (especially the expensive ones) and snack during the fall, winter, and spring. A dead plant with a quarter-sized tunnel nearby is a sure sign of voles. Check with your local Cooperative Extension service on eradication methods available in your area.
Heat Hardiness Maps
One of the most frustrating problems for gardeners in the south is summer hardiness. Reference books and most plant catalogs have completely neglected the effects of heat on plants. Many plants from the north are not able to withstand our hot summers. In 1997, the American Horticulture Society published a "heat map", and while a good idea, the map as published serves no practical purpose for gardeners. The Heat-Zone Map confuses gardeners with two sets of numbers ... i.e., Zones 5-9 and 9-5. One set of numbers is for cold and one for warmth. There is no reason that one complete map could not serve both needs.
A good example of a heat hardiness discrepancy is lady's mantle (Alchemilla vulgaris), a perennial featured in English gardening books. Due to our summer climate in Raleigh, NC, it is virtually impossible to grow this plant in the south. Another example is the beautiful mountain ash (Sorbus sp.) with the bright red berries in the fall. Try as we might, the mountain ash will not tolerate our summers.
But wait, gardeners in Zone 7 on the West Coast can grow these plants successfully ... what gives? The Heat-Zone Map simply shows the number of days above 86 degrees F or each region of the country. Heat hardiness is more an issue of night temperatures, humidity, and precipitation during the hot season, not simply the number of days above 86 degrees. As we mentioned, another wrench enters the picture when we talk about night temperatures as compared with day temperatures. In many cases, the culprit is not only the high day temperatures that cause plants problems, but also the high night temperatures. During the day, plants store up energy produced through photosynthesis. If the nights are cool, the energy goes into growth of the plant. If the nights are too warm, the energy is burned up by the plant. Many plants, due to their metabolism derived in a cool night climate, are not hardy in other areas, simply because of their warm night temperatures.
Hosta 'Cabaret'
There is still another factor in heat hardiness that we have overlooked ... one of dormancy. A hosta, for example, will not grow well in parts of Florida, (parts of Zone 9, and 10). The problem here is that temperatures do not drop low enough in the winter time for the plant to go completely dormant. Many plants, both perennial and woody, must have a specific dormant period in order to start growth again in the spring. A hosta must be exposed to at least one month of temperatures below 40 degrees F. If this temperature requirement is not met, the plant will begin to decline in the spring, or in the case of some trees, will never resprout in the spring until the dormancy requirement has been satisfied.
Good Maps Gone Bad
After the 1997 Heat Hardiness Map fiasco, the American Horticulture Society made an even bigger horticultural faux pas when, in 2003, they published a draft revision of the 1990 Hardiness Zone map. It's called a "draft" version because interested parties notified the USDA about the impending screw-up just prior to publication, and the project was halted immediately. The 2003 draft map, using data from 4,700 weather stations, was compiled using the premise that the climate had warmed so dramatically that only the last 15 years (1987-2001) of climatic data was needed. This recent data shifted Chicago, IL, into Zone 6, making for a true horticultural disaster when a real winter such as 2002/2003 occurred. The 2003 map also eliminated the "a" and "b" designations which would put two completely different climates, such as Wilmington, NC, and Wilmington, DE, into the same zone. This change was being made to make the map more "readable." The 2003 map also added more tropical zones, 12-15. The 2003 map certainly tops the all-time horticultural "what were they thinking?" list. In 2006, the Arbor Day Foundation released a map similar to the 2003 AHS map, which made the same unfortunate errors in judgment by including only 10 zones and using a 15-year dataset.
New USDA Hardiness Maps on the Way
On August 18, 2004, a group of stakeholders first met at USDA-ARS offices in Beltsville, Maryland to discuss the 1990 USDA Plant Hardiness Zone Map revision. The August 18 meeting included representatives from USDA-ARS, the American Horticulture Society, the American Association of Botanic Gardens and Arboreta, university researchers, and representatives of the nursery industry. There have been several meetings since, as work on the new map progresses. In 2007, the contract to produce the new map was awarded to the Prism Climate Group from Oregon State University.
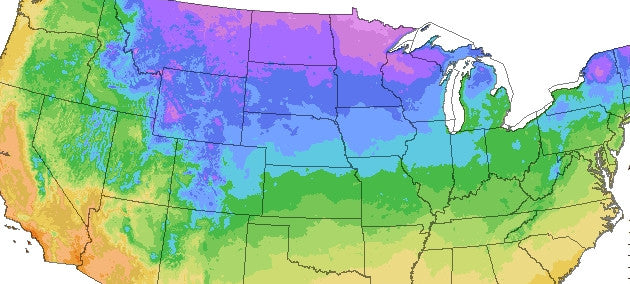
The hardiness map revision project will consist of two phases. In Phase I, the map will be reconstructed using the most recent 30 years (up from 15 years) of average annual extreme minimum temperatures. The map will also retain the "a and b" designations for zones 2-10, but not for zone 11 and zone 1. For the first time, the map will include a better breakdown of coastal/lake effects and elevation differences. The map will be made available on-line where you can search for and zoom in on a target area. The map is nearing completion at the beginning of 2008. Preliminary draft maps show many areas that have warmed up to 7 degrees from the 1976-1990 period to the 1991-2006 period. Other parts of the country have seen their average minimum temperature rise only a degree or two. Final details and concern of the committee are being addressed at this time. Phase II of a possible future project will hopefully involve overlay maps for other factors such as duration of cold, summer heat factors, and perhaps even air flow patterns.
Summary
What I hope you will realize is that growing plants can be very complex. The hardiness zone maps are a great guide, but are only a guide and only when the zones assigned to plants by nurseries are accurate. Don't be frustrated when a new plant dies, and certainly don't give up trying to grow that particular plant. After you kill it three times, use the compost you've created to help grow another plant.